Net revenue, June
53,400EUR
+12.4% up vs May
Sales after discounts and returns, excluding VAT.
ERP · sales invoices · refreshed today, 07:00
Reporting & dashboards
+66.9% up Jun vs Jan
Example data Net revenue · ERP sales invoices · refreshed today, 07:00Dashboards and recurring reports from the systems you already run. Every total shows where it comes from, when it was refreshed and how it is calculated.
One-off setup + monthly subscription · EU hosting · Support in English and Romanian
| Month | Net revenue (EUR) |
|---|---|
| Jan | 32,000 |
| Feb | 35,000 |
| Mar | 37,500 |
| Apr | 41,000 |
| May | 47,500 |
| Jun | 53,400 |
53,400EUR
+12.4% up vs May
Sales after discounts and returns, excluding VAT.
ERP · sales invoices · refreshed today, 07:00
375orders
+11.6% up vs May
Completed orders, counted once.
POS + online orders · refreshed today, 07:30
142.4EUR
+0.7% up vs May
Net revenue ÷ completed orders.
Calculated from the two figures on the left
| Indicator | Value | Change vs May | Definition | Source |
|---|---|---|---|---|
| Net revenue, June | 53,400 EUR | +12.4% | Sales after discounts and returns, excluding VAT. | ERP · sales invoices · refreshed today, 07:00 |
| Orders, June | 375 orders | +11.6% | Completed orders, counted once. | POS + online orders · refreshed today, 07:30 |
| Average order value | 142.4 EUR | +0.7% | Net revenue ÷ completed orders. | Calculated from the two figures on the left |
01 / Ask the question
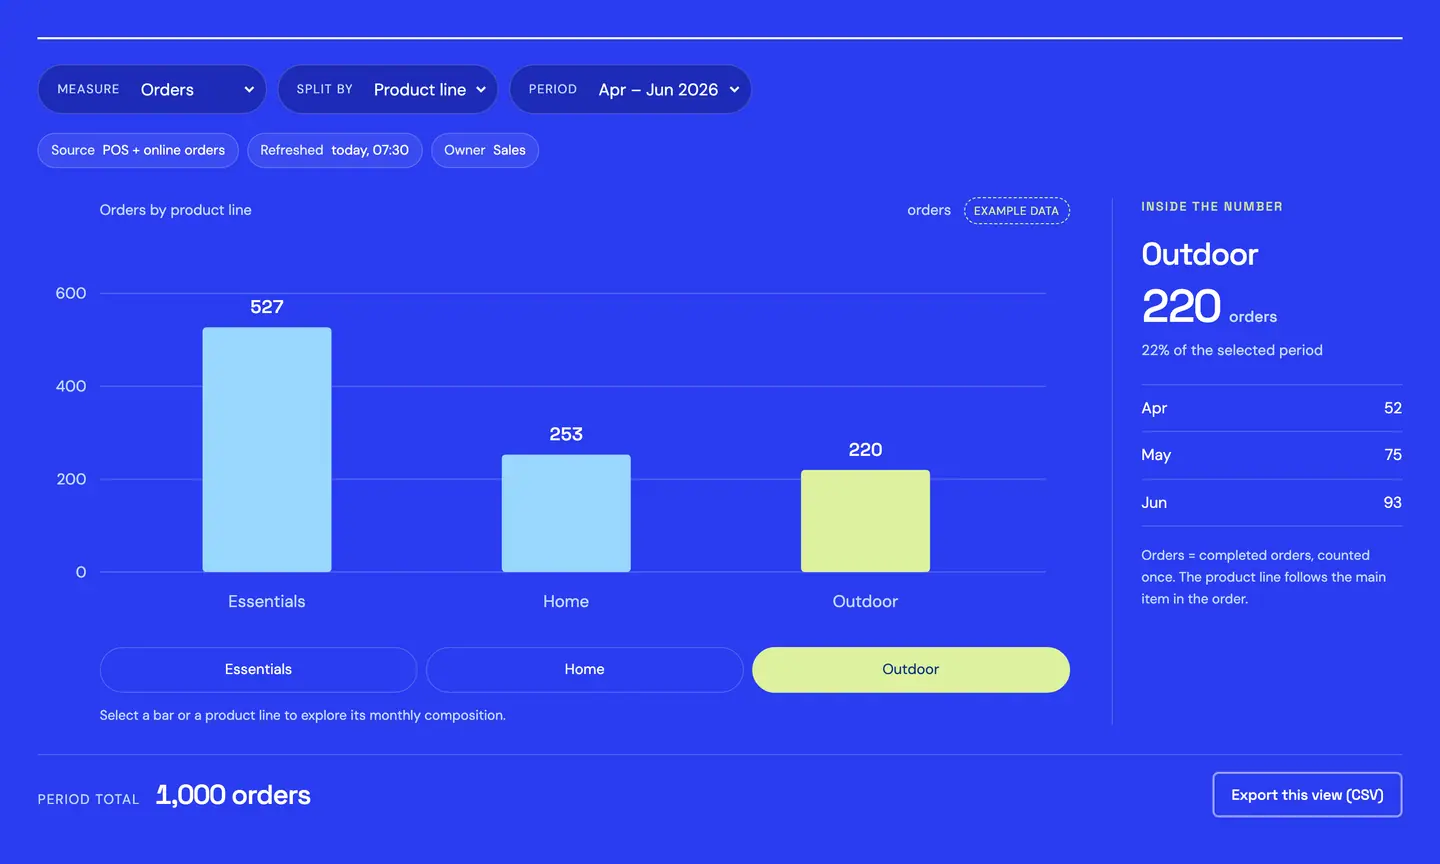
Change the measure, the split or the period. The definition, the total and the table follow the view.
Select a bar or a product line to explore its monthly composition.
| Product line | Net revenue (EUR) |
|---|---|
| Essentials | 127,500 |
| Home | 71,100 |
| Outdoor | 47,800 |
02 / Report vs live
The spreadsheet still has its place: CSV export stays one click away.
| Today: spreadsheets by email | Today: a BI tool your team maintains | With Reports | |
|---|---|---|---|
| Who connects the data | You, every week | Your team configures connectors | We set it up with you; each source is confirmed during scoping |
| Metric definitions | Implicit | Possible, your team writes them | Written and signed off in the project |
| Source and freshness per total | No | Depends on setup | On every total |
| Local tax context (currency, VAT, e-invoicing statuses) | Manual | Configured by your team | Set up in the project (currency and VAT; RO e‑Factura statuses for companies operating in Romania) |
| Company and role filters | Separate files | Configured by your team | Agreed and set up in the project |
| Support | — | Depends on the vendor | In English and Romanian, from the team that set it up |
| Hosting | Wherever the files travel | Depends on the vendor and plan | EU |
Already using a BI tool? Reports feeds it the same agreed definitions.
03 / Example dashboards
These are the reports we most often scope. Each one uses your own sources and definitions.
A line connects points in time. This view compares categories, so it stays as bars, tiles or a table.
| Category | Value (EUR) |
|---|---|
| Online shop | 89,300 |
| Centre store | 58,900 |
| B2B accounts | 50,600 |
| North store | 47,600 |
| Total | 246,400 |
A line connects points in time. This view compares categories, so it stays as bars, tiles or a table.
| Category | Value (EUR) |
|---|---|
| Main warehouse | 412,000 |
| Centre store | 96,500 |
| North store | 71,200 |
| In transit | 18,300 |
| Total | 598,000 |
A line connects points in time. This view compares categories, so it stays as bars, tiles or a table.
| Category | Value (EUR) |
|---|---|
| Not yet due | 148,000 |
| 1–30 days late | 61,500 |
| 31–60 days late | 22,800 |
| Over 60 days late | 9,400 |
| Total | 241,700 |
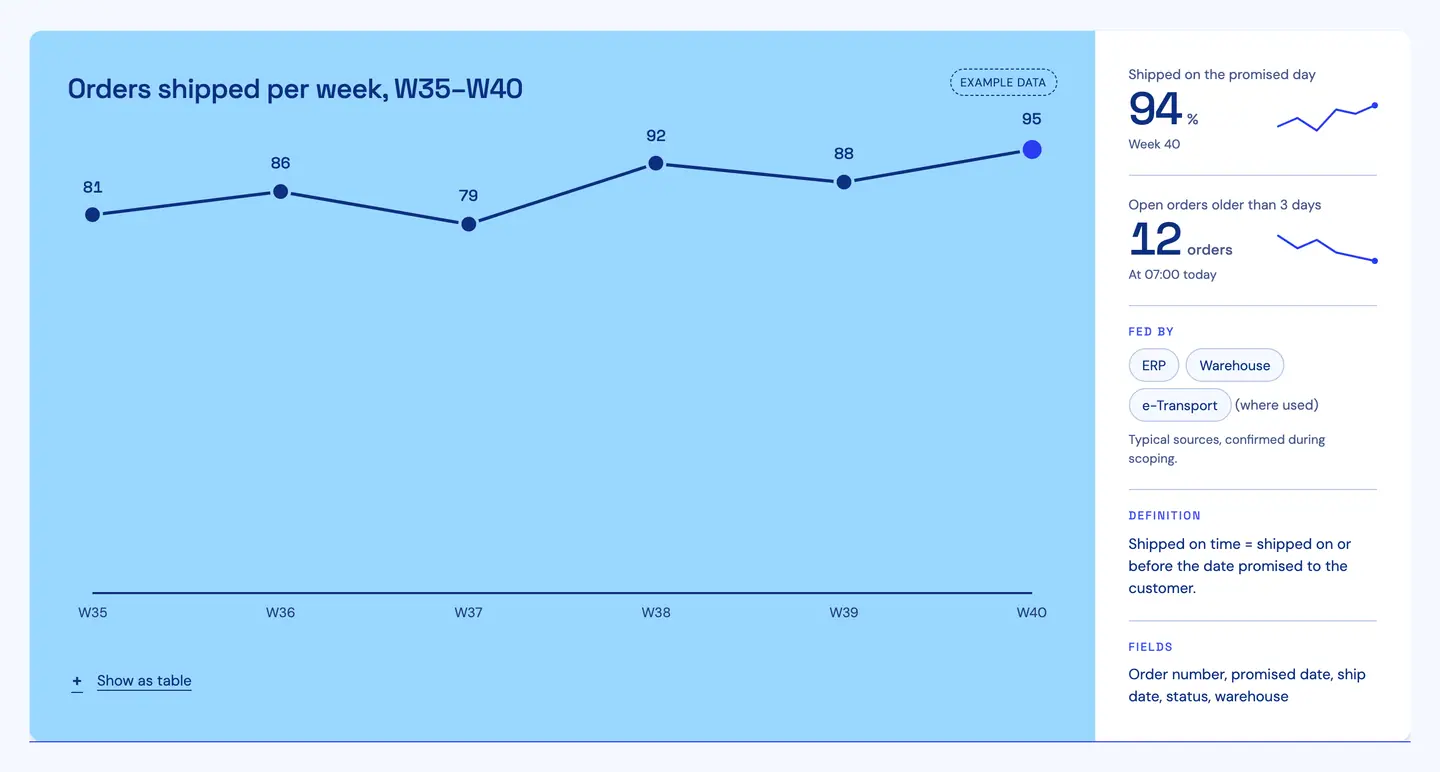
| Period | Value (orders) |
|---|---|
| W35 | 81 |
| W36 | 86 |
| W37 | 79 |
| W38 | 92 |
| W39 | 88 |
| W40 | 95 |
| Total | 521 |
The product
Finance, sales and operations in the same layout: the chart, the indicators beside it and the definition of every figure underneath.
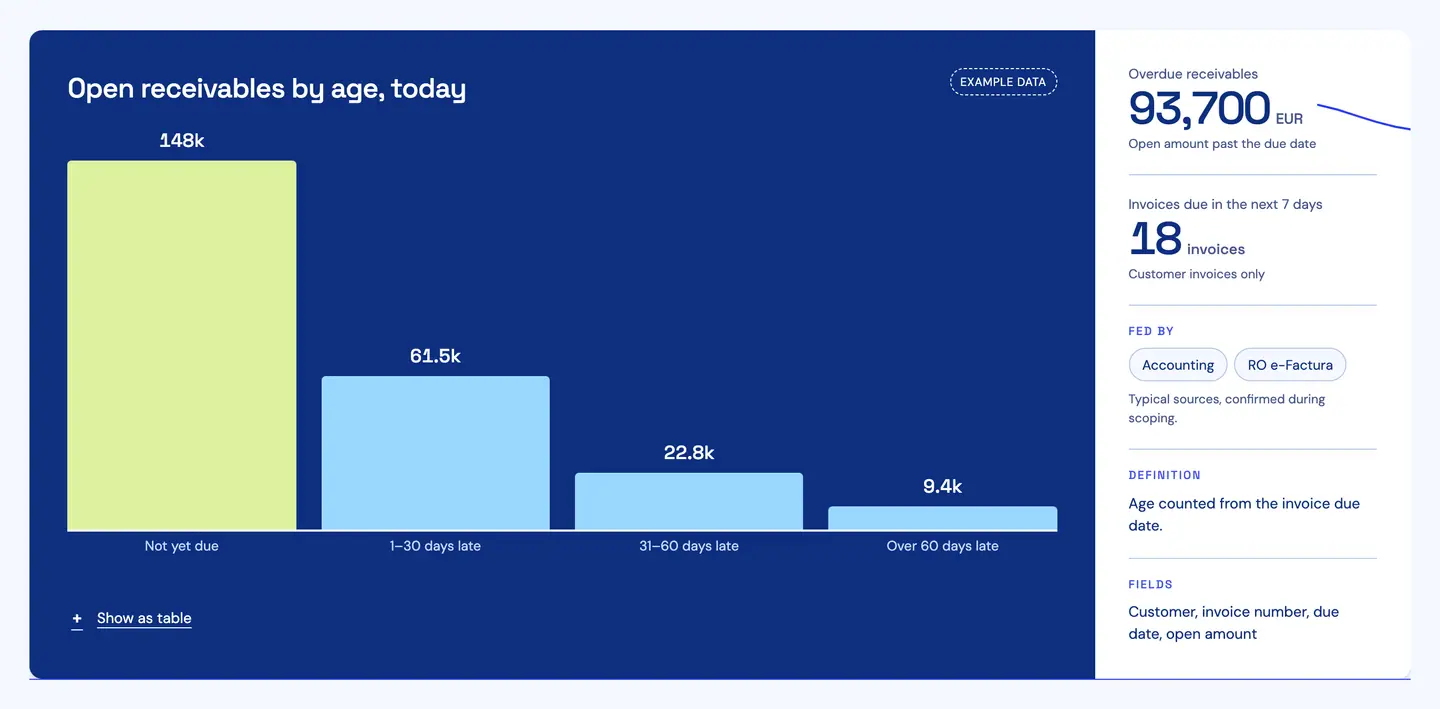
Example dataFinance view: open receivables by age, with overdue indicators and the metric definitionOpen full size (opens in a new tab)
04 / Before the chart
We locate the records in your ERP, sales system or files, name an owner for each dataset and agree the checks that make it usable.
IntegrationsRevenue before or after returns? Orders placed or delivered? We write down the calculation, currency, time zone and exclusions before anyone compares totals.
AccountingWe agree the refresh window, who reviews the figures and how they arrive.
See a delivery scheduleA shared link with sign-in and filters, with the detail behind a total as agreed in the project.
The weekly operations report sent on an agreed day, with the system and date for each total.
CSV files with the period, grouping and totals you were looking at; Excel where agreed in the project.
05 / Control
Each total names its system and the time of the last refresh, so an old number is visible as old.
A short metric dictionary sits beside the dashboard, and the definition is shown next to each total.
Group companies, departments and managers see the slice they are allowed to see. Which views and exports each role gets is agreed in the project.
Data location, access and retention are written into the project before go-live.
| Metric | Calculation | Source | Owner | Refresh |
|---|---|---|---|---|
| Net revenue | sales − discounts − returns, excl. VAT | ERP invoices | Finance | daily, 07:00 |
| Orders | completed orders, counted once | POS + online | Sales | daily, 07:30 |
| Stock value | quantity × unit cost (weighted average or FIFO, per your accounting policy) | Inventory | Operations | daily, 06:00 |
| Overdue receivables | open amount past due date | Accounting | Finance | daily, 07:00 |
598,000EUR
All locations, including stock in transit
Example data The definition and source stay the same; only the slice changes.
06 / Sources
Each connection is confirmed and tested during scoping. None is assumed to work out of the box.
Reports
Agreed definitions · source and freshness on every total
Other R&D COPILOT products, or no suite at all? We start from your existing exports and systems and scope each connection individually.
07 / Pricing model
One-off
Source mapping, metric definitions, first dashboards and recurring reports, role setup and team walkthrough.
Monthly
EU hosting, scheduled data refreshes, updates, backups and support in English and Romanian.
Agreed up front
New reports or sources at a fixed hourly rate, estimated before work starts.
You get a written quote after we see your sources and the decisions the reports must support.
Decisions we make together
08 / Questions
Something not covered here? Ask it in the brief and we answer in writing.
The R&D COPILOT products you use, such as ERP, POS, inventory and accounting, plus files and other systems through APIs or scheduled imports. Each source is confirmed and tested during scoping.
As fresh as the refresh window we agree for each source: hourly, daily or weekly. The time of the last refresh is shown next to every total.
You do. We write the definition with the metric’s owner, you sign it off before the dashboard goes live, and it is shown next to the number.
Yes. Company and role filters are set up in the project, and role changes are handled through the agreed access process.
Yes. The current selection exports to CSV with the period, grouping and totals you selected; Excel files where agreed in the project. If you end the subscription, you take all your exportable data with you.
In the EU. We sign a data processing agreement with you (GDPR Art. 28), and data location, access and retention are agreed in writing for your project.
A one-off implementation fee and a monthly subscription. New reports or sources later are quoted up front at a fixed hourly rate.
We follow both totals back to their records, compare periods, statuses and definitions, and keep one agreed version. Our guide explains the method. Read the guide
From idea to implementation
Build role-based reporting with consistent company and team boundaries across summaries, drill-downs and exports, including checks for changing user membership.
Read guideReconcile conflicting reports by checking business meaning, periods, statuses and source lineage, then explain each difference with traceable underlying records.
Read guideChoose operational dashboard measures around real management decisions, with clear definitions, source freshness and links to the records and actions behind totals.
Read guideTell us what you need to decide, where the data lives and who needs the answer. We’ll come back with a scoped first report.
One-off setup + monthly subscription · EU hosting · Support in English and Romanian
© 2026 R&D COPILOT Made in EU Contact form